Receiver Operating Characteristics (ROC) Analysis (Part 1 of 3)

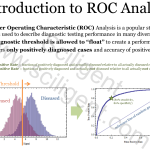
This is the first part of a three-part series of posts that will walk through a typical data analysis engagement we perform for clients.   This part will address aspects of the service and setup.  The second part will address the problem faced by the client (in this example, diagnostic pathology).  The 3rd part will summarize our conclusion and interpretation and how that data analysis (in this example, ROC analysis) impacts the problem. Motivation Part of the services we offer is advanced data analysis.  Many types of statistical data analyses are agnostic to the field of study, and require only […]

Neil Tyson touches on Scientometrics

During a talk on science policy, Astrophysicist Neil deGrasse Tyson shows some scientometric charts with interesting visualizations.  Specifically he shows the volume of scientific articles as a function of country of publication, as well as the rate of publication growth.  On a map of the Earth, the geographical size of each country is increased or decreased in proportion to this amount. Here is the total publications map:  The USA, Europe and Japan dominate.   Here is the rate of growth map:  Europe and Japan are both growing strong, while China is rapidly on the rise, and the USA definitely growing much […]

Co-Affiliation Collaboration Networks

Last month, we participated in a symposium on Technology Forecasting at the Library of Congress.  Here is the poster we displayed at our vendor booth showing our approach to Co-Affiliation Collaborative Mapping. Download the poster to get a better view: Co-Affiliation Collaboration Map (Poster)        

Applied Scientometrics for Government Program Managers

Government Program Managers, Download our latest promotional sheet describing the advantages of using scientometrics for your agency’s mission here. Scientometric Solutions for Government S&T Needs What do you need to accomplish your agency’s mission? New Program Start:  How do you decide what new research program to start?  How do you assess the maturity of that field of research? Workshop Planning:  Who are the best researchers to invite to your workshop, symposium or conference?  How can you be sure you aren’t leaving out anyone important? Portfolio Management:  Did you inherit a research portfolio? How do you know you have the best […]

Introducing Scimetry Reports…

We’ve completed the development of our prototype!  We’re now rolling this into a service before we develop it into a product.   The Scimetry Report is a new type of report for the science professional that is generated using semi-automated, quantitative methods for visualizing knowledge and measuring global progress in the research and development of scientific fields. All reports include the following scientific metrics: A collaboration map of institutional powerhouses A ranking of high performance talent An analysis of major research fronts A trend analysis of specific research progress   Background The activity of the science, technology and innovation community […]

Our founder’s work on scientific networks published

Our article on “Statistical Common Author Networks” was published recently in the Journal of the American Society for Information Science and Technology.  The article is available on the JASIST website to download or purchase here.  Below is the abstract to give you an idea about what the article is about: ABSTRACT:  A new method for visualizing the relatedness of scientific areas has been developed that is based on measuring the overlap of researchers between areas. It is found that closely related areas have a high propensity to share a larger number of common authors. A method for comparing areas of […]

Patent Bipartite Networks

We’re experimenting with different databases and analytical approaches.  Below is a bipartite assignee-applicant network that shows how companies are linked together through shared inventors. Database:  This data comes from a single week of patents granted by US Patent and Trademark Office (USPTO) database.  This is a very small part — there are roughly 7000 patents granted per week by the USPTO alone.  Note that this does not necessarily mean these patents were filed in the same week since the review time does vary. Analytics:  The network map was created by linking every inventor (in blue) with the associated assignee (in […]

Launched!

We launched this week! (yesterday, actually). On the horizon: We’ve started code development with a target prototype product to launch early October for our advance customers.  This will be only accessible as a consulting service for now, but we hope to follow quickly with a data browser for rapidly viewing the results. Our other products will launch as staggered releases, depending on how quickly we can develop on the other platforms. We’ve started work for a new private-sector client today!  Hopefully we’ll be able to say a little more than that, but we’ll see. We’re considering scientific computing as another […]