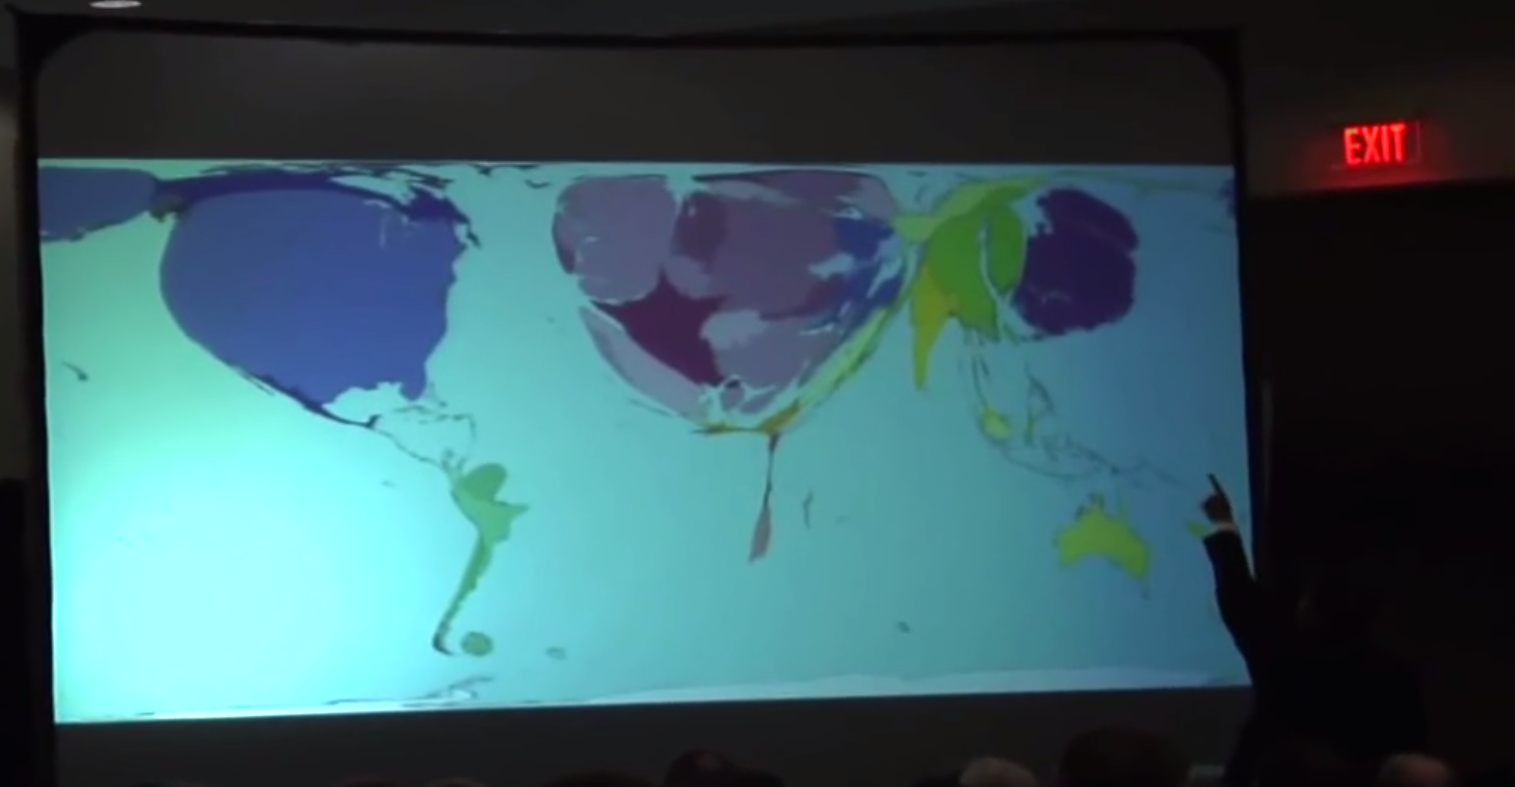
During a talk on science policy, Astrophysicist Neil deGrasse Tyson shows some scientometric charts with interesting visualizations. Specifically he shows the volume of scientific articles as a function of country of publication, as well as the rate of publication growth. On a map of the Earth, the geographical size of each country is increased or decreased in proportion to this amount.
Here is the total publications map: The USA, Europe and Japan dominate.
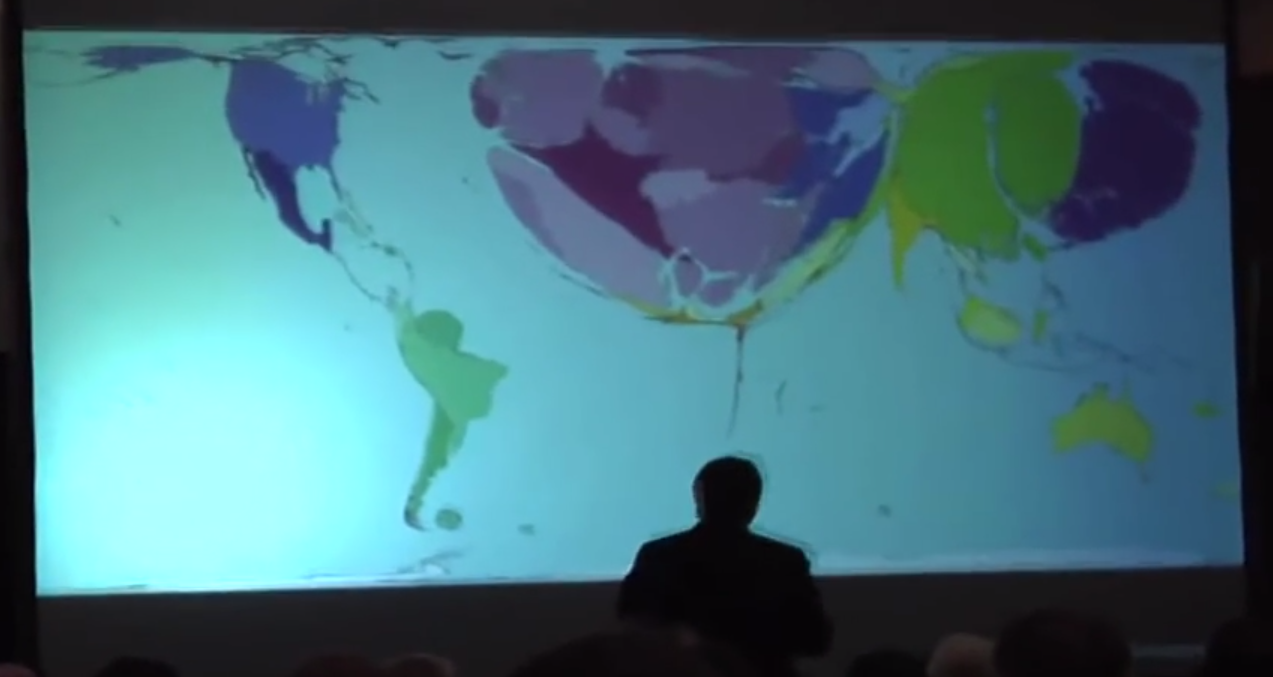
Here is the rate of growth map: Europe and Japan are both growing strong, while China is rapidly on the rise, and the USA definitely growing much slower.
Check out the full video below, which skips right to the scientometrics portion of Tyson’s talk