This is the first part of a three-part series of posts that will walk through a typical data analysis engagement we perform for clients. This part will address aspects of the service and setup. The second part will address the problem faced by the client (in this example, diagnostic pathology). The 3rd part will summarize our conclusion and interpretation and how that data analysis (in this example, ROC analysis) impacts the problem.
Motivation
Part of the services we offer is advanced data analysis. Many types of statistical data analyses are agnostic to the field of study, and require only the proper interpretation of the scientific experiments performed in order to be implemented effectively. Here, we present an example (with sensitive details omitted) of work we perform for clients at small R&D companies who need to outsource data analyses when their staff are overloaded and do not have the time to research and develop expertise in a particular type of data analysis, especially if it may not be used in the future. In such cases, it is often both time and cost efficient to use our services to deliver a scientific analysis. Additionally, it can often be to the benefit of a company conducting a study to submit the data to that study for evaluation by an independennt 3rd party in order to build their credibility when representing their data to skeptical customers.
Summary of Process
In a typical engagement, we perform a brief consultation to understand the problem at hand and assess the tools/analyses needed to extract meaningful, actionable conclusions from the data. A quote is developed along with a delivery date, then with the client’s agreement, work begins. This culminates with the briefing of the results and conclusions of the analysis to the client, thus concluding the project.
Diagnostics
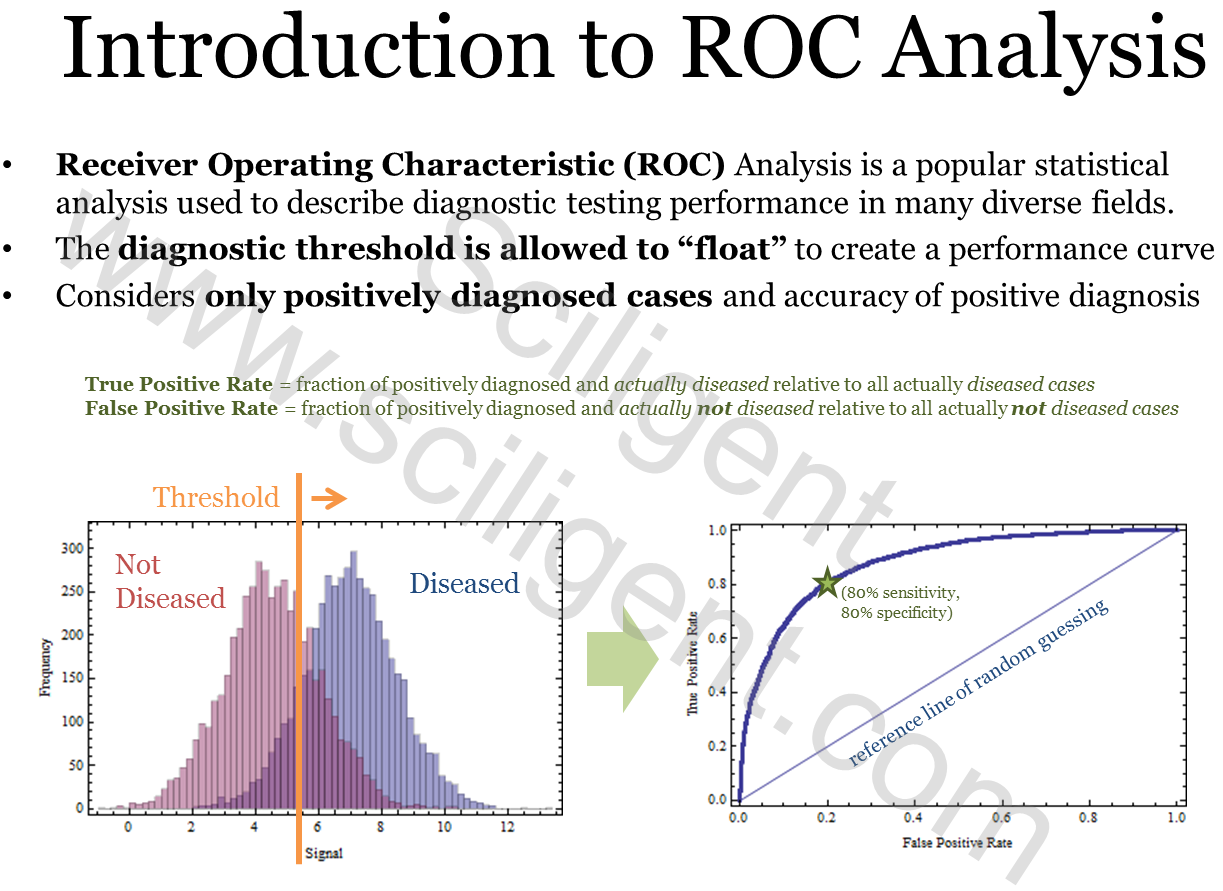
For this particular engagement, the client was interested in assessing the diagnostic capability of a product they were developing and turned to us to provide an objective evaluation. For any diagnostic method or predictive method, the success rate (Probability of Detection) versus the false positive rate (Probability of False Alarm) are key aspects in determining how well that diagnostic works. Regulatory agencies have standards these diagnostics must meet for approval or certification. A typical one, for example, would be a success rate not below 80% and a false alarm rate not above 20%. The answer we must arrive at is “does the diagnostic method developed meet this criteria for approval?” and we must develop the analytical method to support it. Luckily, this can be done using Receiver Operating Characteristics (ROC) Analysis. When the client approached us with the problem, part of our expertise is in selecting the right analytical approach that would yield the answer to this question, and choosing the right analysis is part of the service we provide. Far better explanations of ROC analysis have been written elsewhere, so rather than write a full description, I suggest you read up on it here in its Wikipedia entry. However, what I will show are the introductory slides that we used to explain in a very simple way what ROC analysis is about — that will be in Part 2. Stay tuned!