Last month, we participated in a symposium on Technology Forecasting at the Library of Congress. Here is the poster we displayed at our vendor booth showing our approach to Co-Affiliation Collaborative Mapping.
Download the poster to get a better view: Co-Affiliation Collaboration Map (Poster)
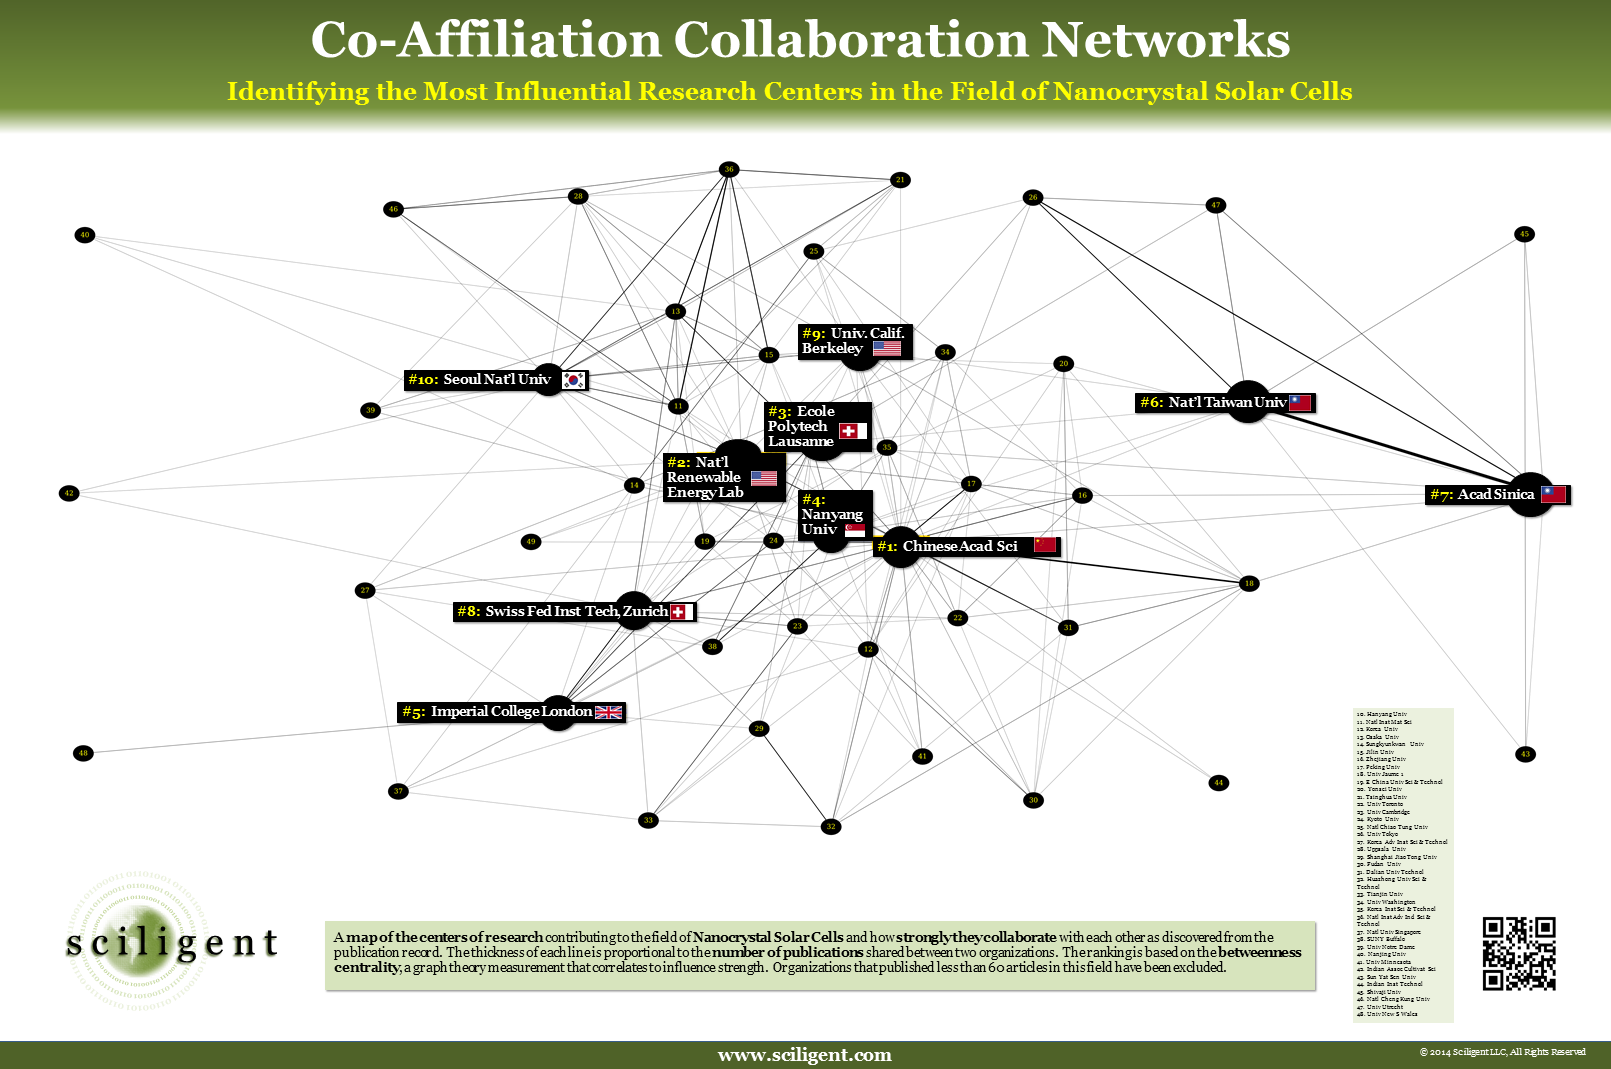
A map of the centers of research contributing to the field of Nanocrystal Solar Cells and how strongly they collaborate with each other as discovered from the publication record. The thickness of each line is proportional to the number of publications shared between two organizations. The ranking is based on the betweenness centrality, a graph theory measurement that correlates to influence strength. Organizations that published less than 60 articles in this field have been excluded. Data Source: Web of Science