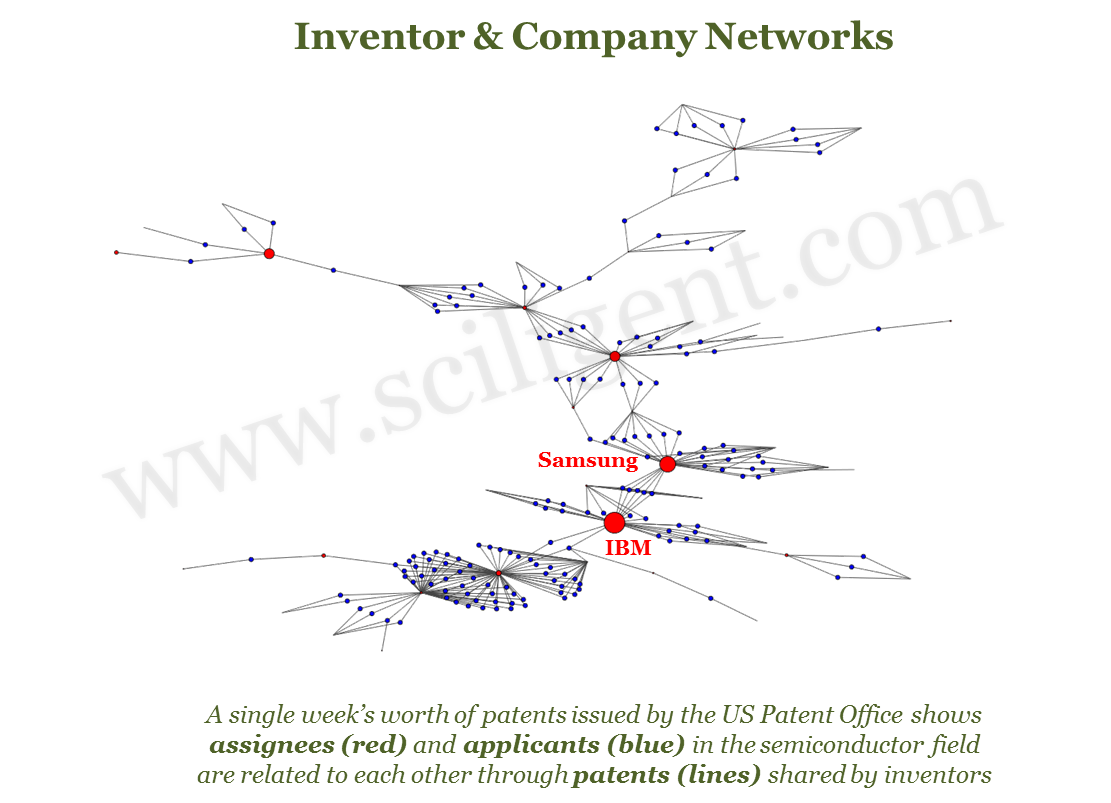
We’re experimenting with different databases and analytical approaches. Below is a bipartite assignee-applicant network that shows how companies are linked together through shared inventors. Database: This data comes from a single week of patents granted by US Patent and Trademark Office (USPTO) database. This is a very small part — there are roughly 7000 patents granted per week by the USPTO alone. Note that this does not necessarily mean these patents were filed in the same week since the review time does vary. Analytics: The network map was created by linking every inventor (in blue) with the associated assignee (in red) for each patent. The map grows as the shared inventors between companies (which may occur due to hiring practices) are connected together. Insight: This map allows for the identification and exploration of influential companies and inventors in each area — in this particular case, the particular RF/semiconductor sector. We’re still experimenting with other representations for this data and hope to incorporate it into some of our future products and offerings.