IEEE Spectrum April 24, 2020
A once‐per‐century geoelectric hazard map is created for the U.S. high‐voltage power grid. A statistical extrapolation from 31 years of magnetic field measurements is made by identifying 84 geomagnetic storms. With these data, we estimate once‐per‐century geoelectric fields at the magnetotelluric survey sites and calculate the theoretical voltages within transmission lines in the U.S. power grid. Once‐per‐century geoelectric field strengths span more than 3 orders of magnitude from a minimum of 0.02 V/km at a site in Idaho to a maximum of 27.2 V/km at a site in Maine. A team of researchers in at the USGS in Denver, CO. show that because of the influence geoelectric field polarization has on geoelectric hazards when viewed on a power transmission network, the transmission line voltages can approach 1,000 V in some transmission lines. Four regions in the United States with particularly notable geoelectric hazards are identified and discussed: The East Coast, Pacific Northwest, Upper Midwest, and the Denver metropolitan area…read more. Open Access TECHNICAL ARTICLE
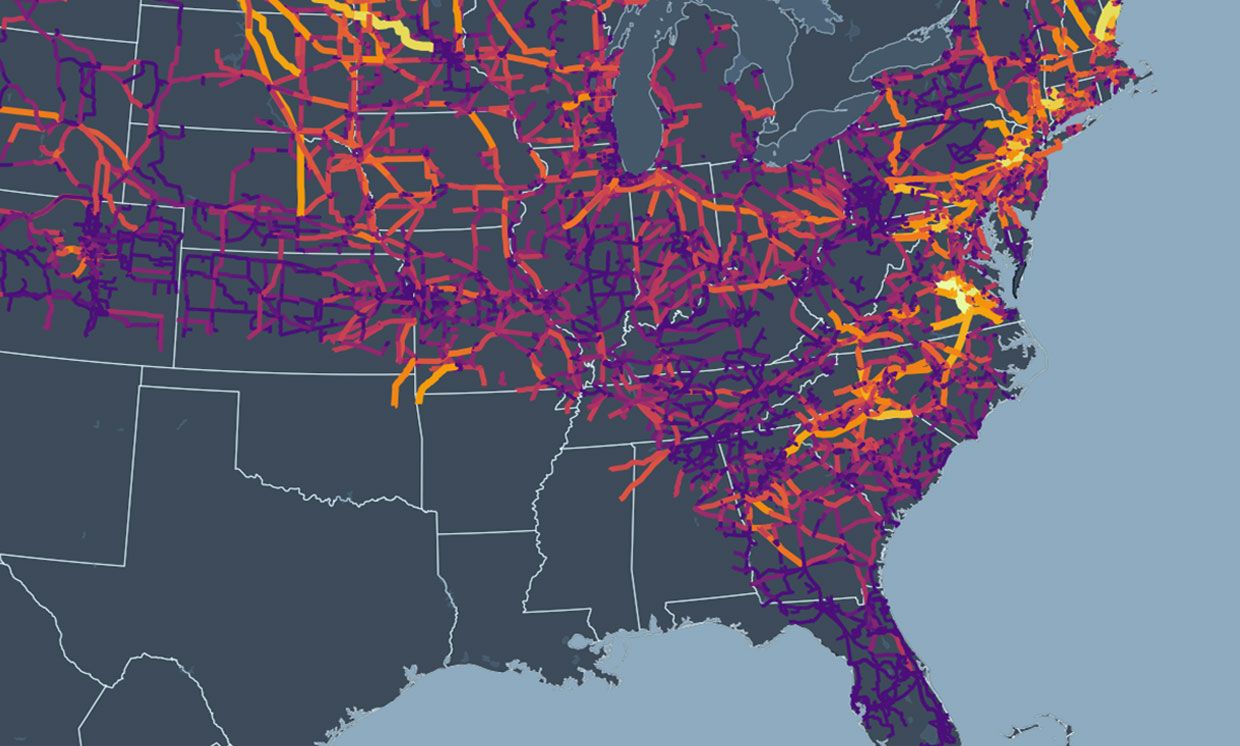
This map shows 100-year storm-induced voltages on the national electric power grid. Credit: U.S. Geological Survey/Wiley